Report and Dashboard Designer - Rapidly Design and Seamlessly Deploy Reports and Dashboards in Minutes
Overview of DBxtra Report & Dashboard Designer
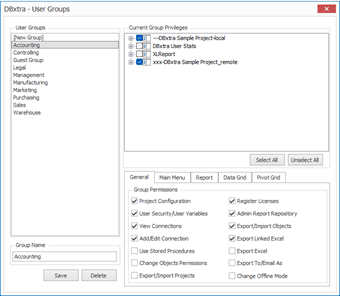
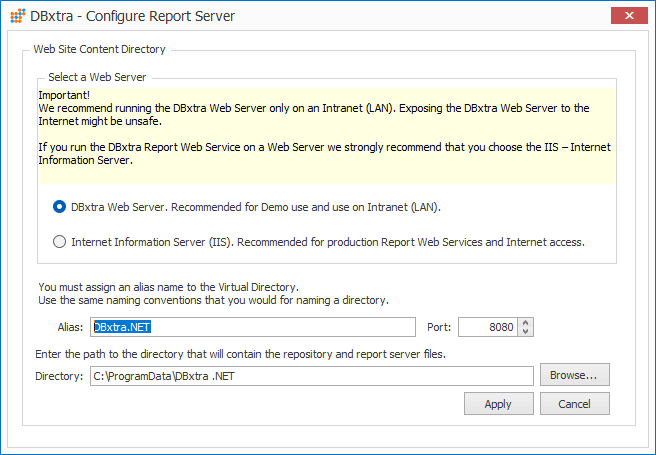
The DBxtra Report & Dashboard Designer serves as the core component of our reporting suite. It enables you to create projects, establish database connections, and define user-groups and user security, while allowing you to design queries, reports, dashboards, charts, data grids, and pivot tables. Once you are ready, deploy reports and dashboards to the Report Web Service, which allows end-users to view secure reports from any web browser.
Play Video about dbxtra report designer interface
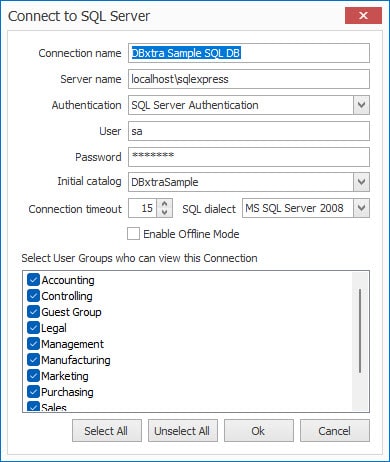
Connect to any data-source located locally, on the LAN or on the Internet
- You can establish a direct connection to various databases such as MS Access, SQL Server, MySQL, Oracle, Pervasive, DB2, Excel, and Text Files. Additionally, you can connect to any other database using ODBC or OLEDB.
- Access tables, views, and stored procedures from your databases
- Connect to Salesforce, MS Dynamics, QuickBooks, Google Apps, Microsoft Office 365, Google AdWords and Analytics, and more through CData ODBC Drivers
- Organize your reports with projects and folders for easy access and management
- Easily edit or change database connections as needed
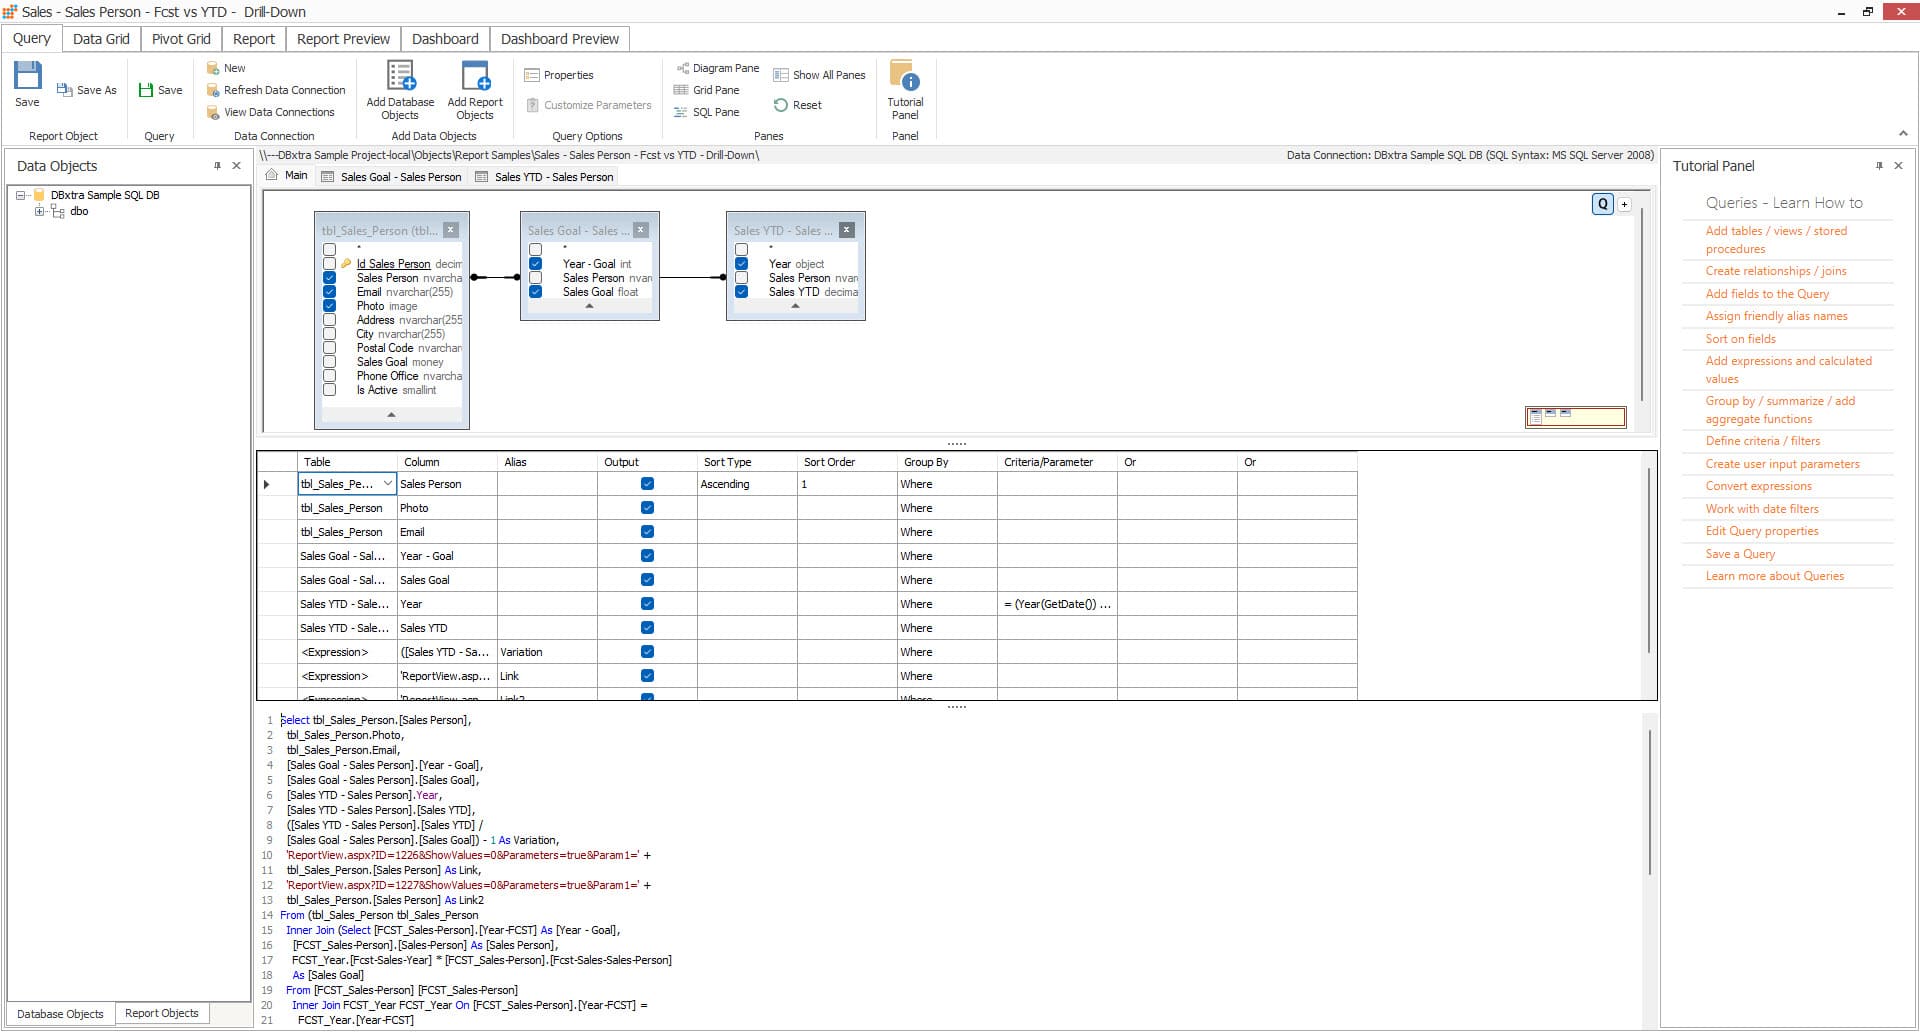
Build Complex SQL Queries Without Writing Code using the Visual Query Builder
- Build complex SQL queries in drag-and-drop mode with the visual query builder, without writing any SQL code
- Create queries from connected database tables and views, or from designed DBxtra objects, or by mixing both
- Write your own SQL syntax or copy-paste queries in the SQL pane as a power user
- Create heterogeneous queries from two or more different databases
- Use unlimited expressions supported by the connected database
- Convert database field types with the expression converter
- Assign groups and aggregate functions like SUM, AVG, MAX, MIN, and more
- Apply filter criteria to refine query results
- Sort query results using data sorting
- Define run-time parameter queries, reports, and charts, enabling end-users to specify parameters when running reports
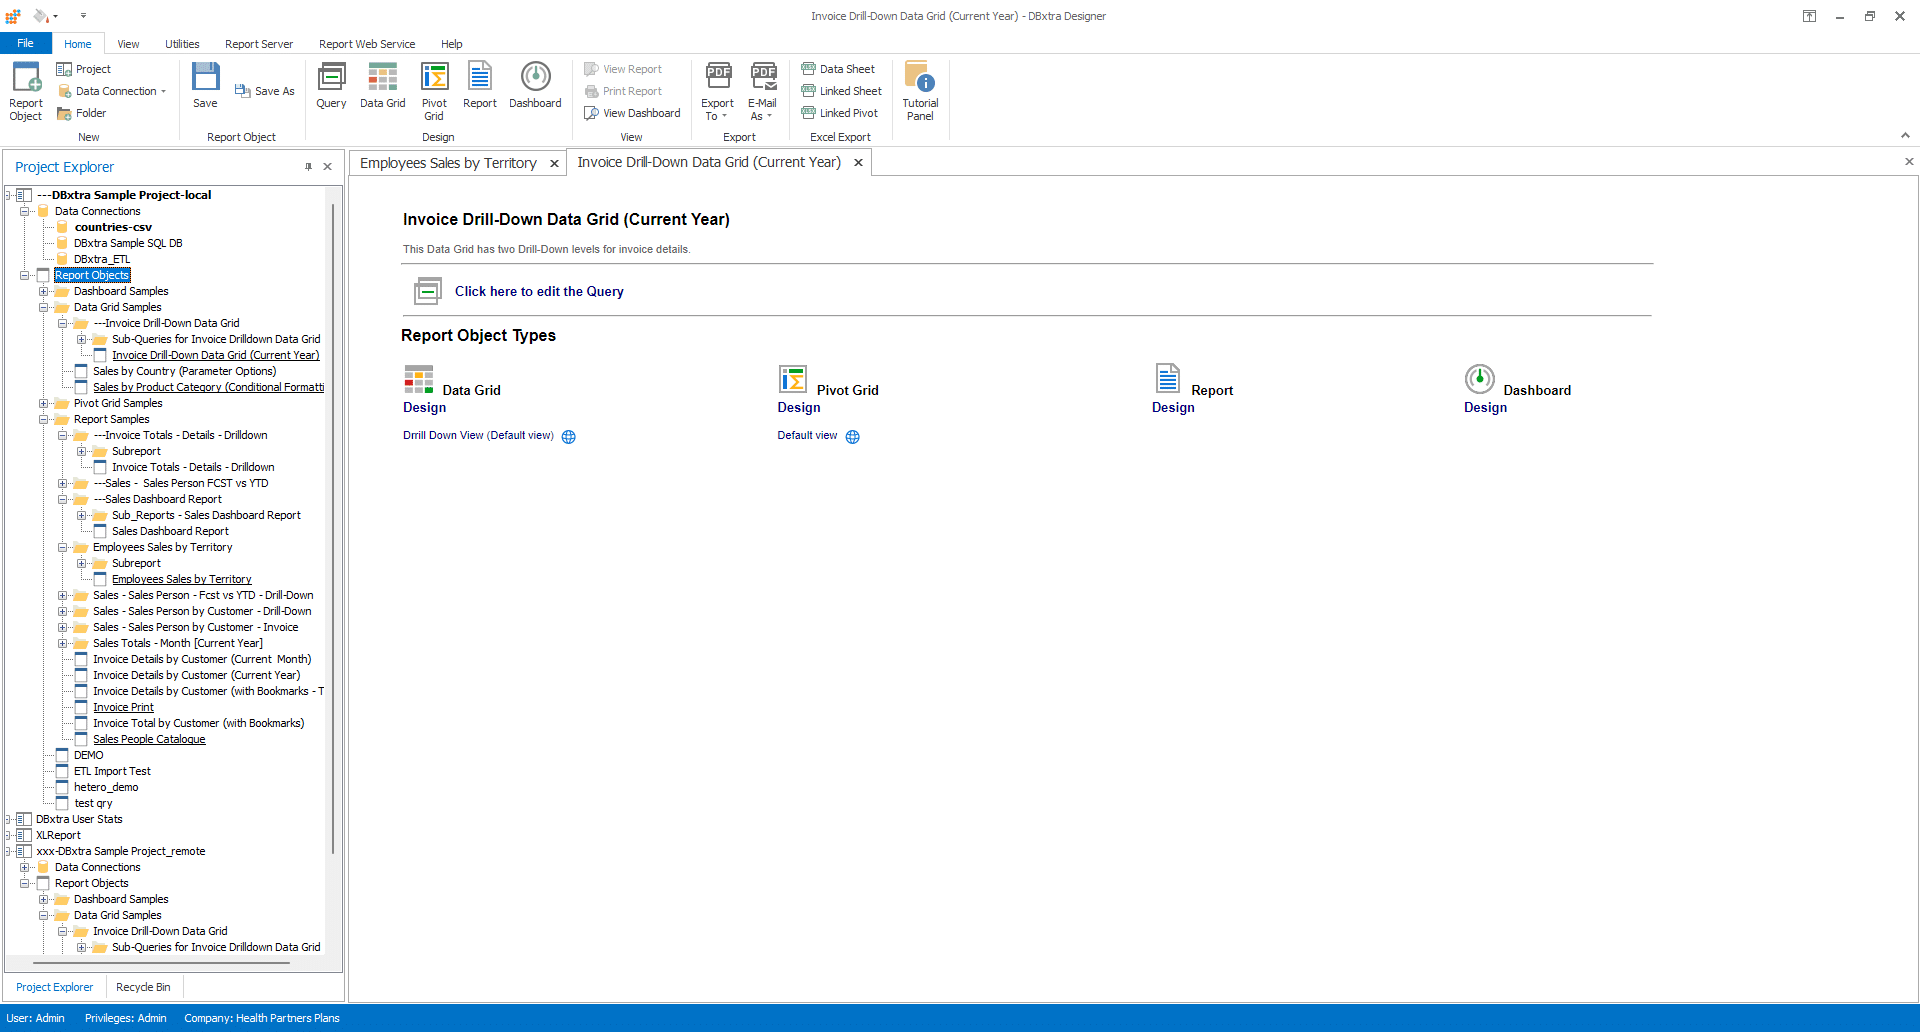
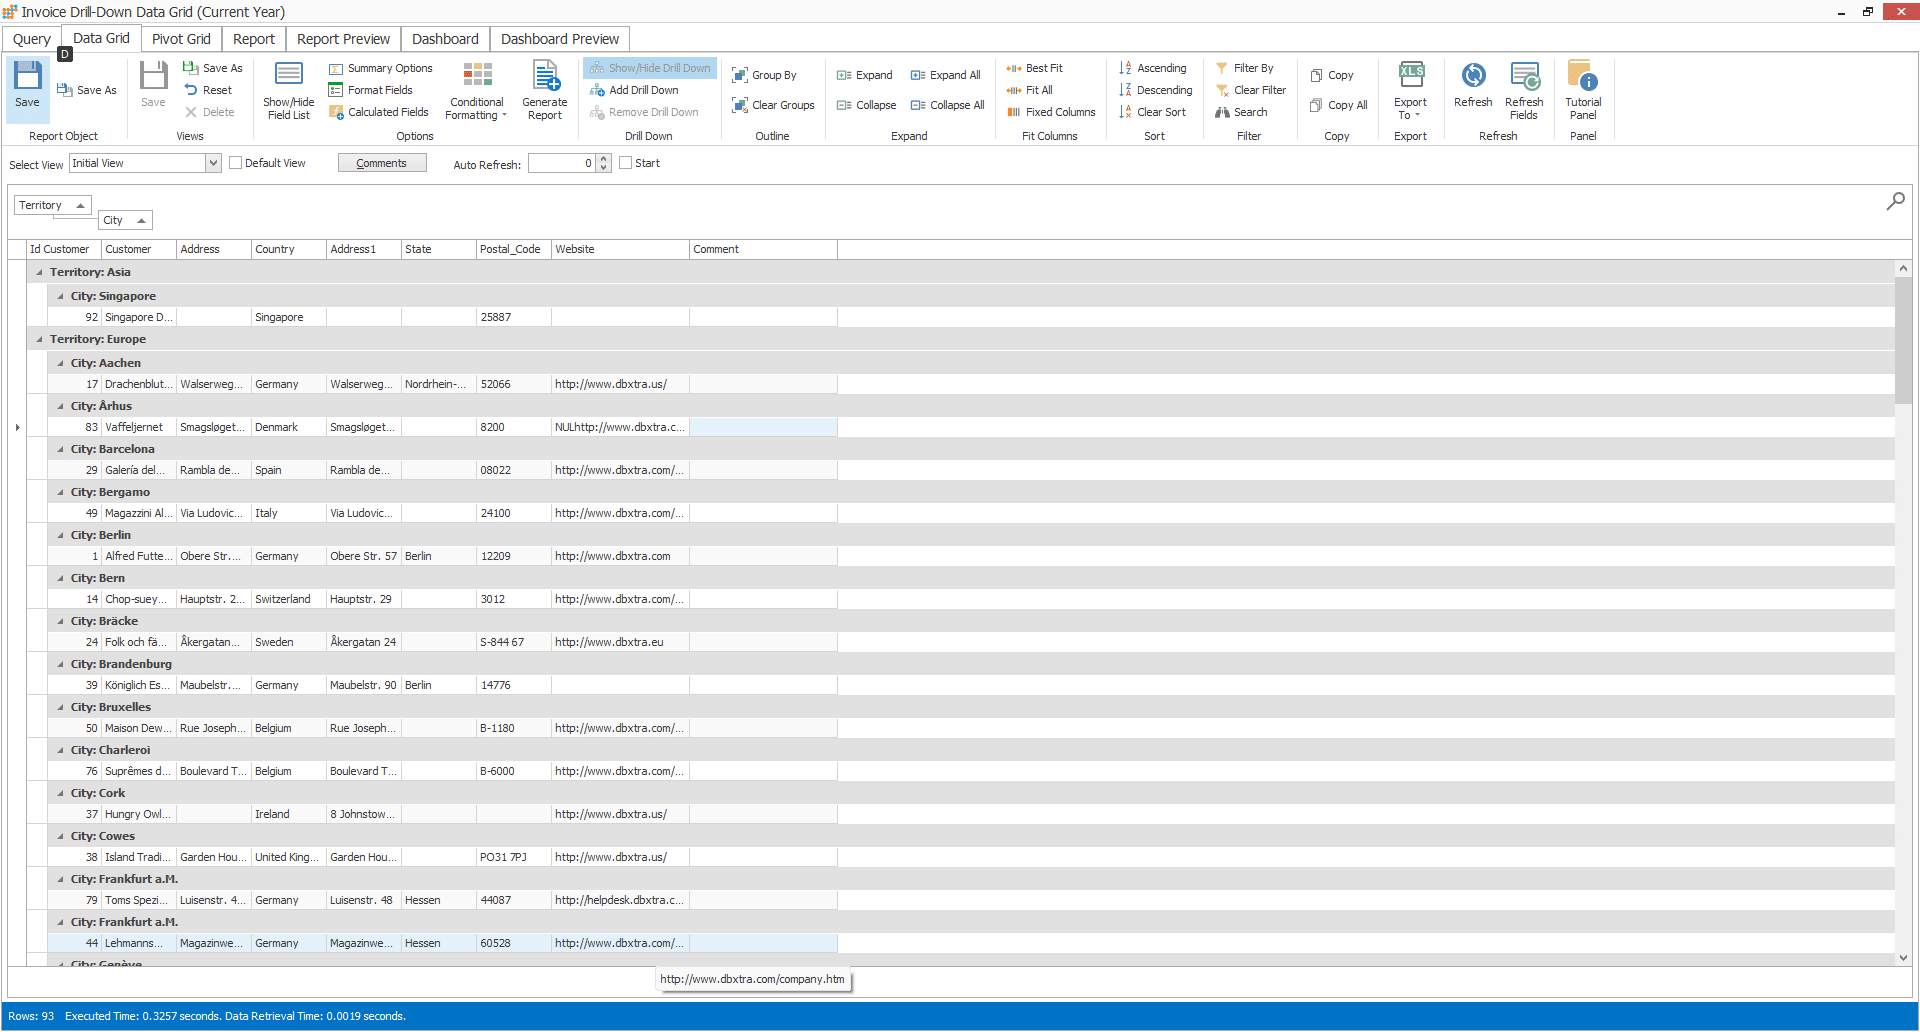
Visualize Your Data in the Data Grid
- Use the Data Grid to preview your data or build a customized data view
- Sort and group by unlimited fields in the Data Grid
- Change column orders and width by dragging and dropping
- Add unlimited drill-down data grid views for in-depth analysis
- Filter data and save filters for quick access
- Search for specific data using the Data Grid
- Select rows and columns to copy data
- Export filtered data to text, CSV, XML, and Excel formats
- Save your favorite data grid views for easy access
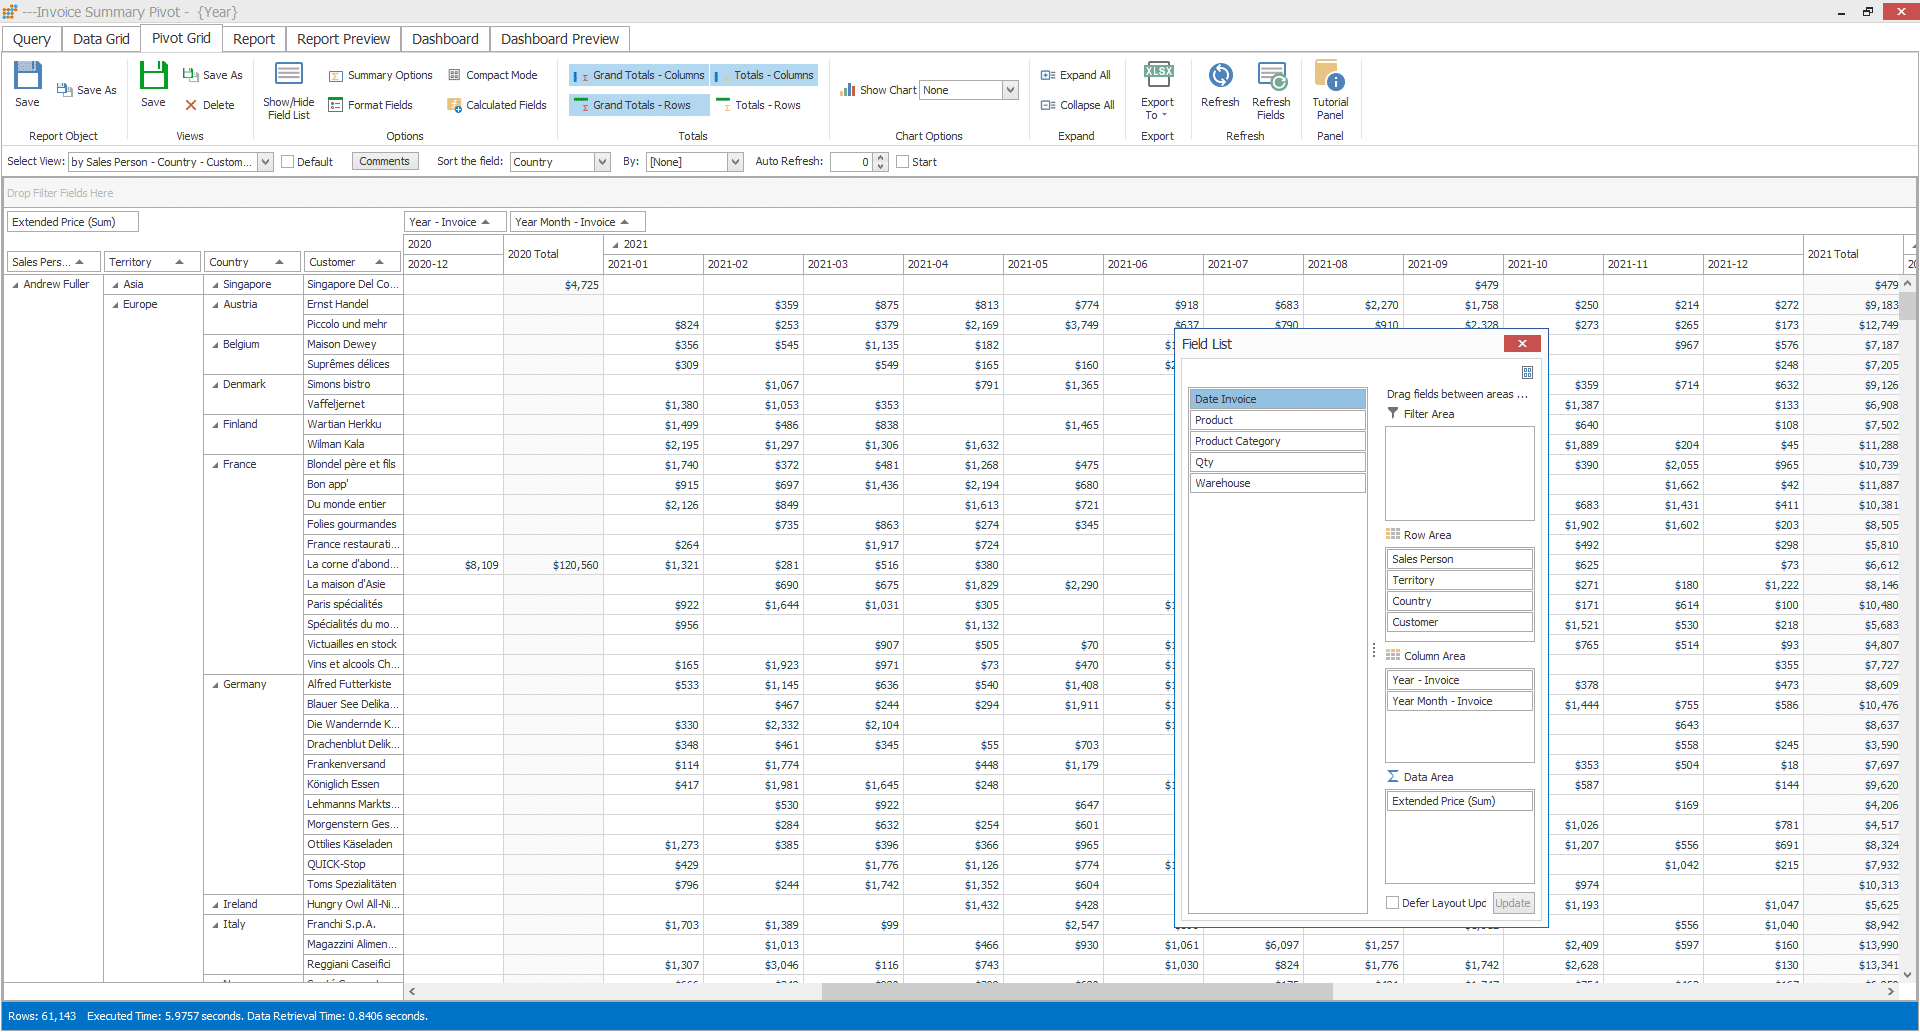
Analyze Your Data with the Pivot Grid
- Create pivot grids to analyze data in different ways
- Sort and group data by any number of fields within pivot grids
- Enhance your pivot grids with charts for visual analysis
- Enable end-users to model their own pivot grids to match their analysis requirements
- Export pivot data to text, CSV, XML, and Excel formats for further analysis or sharing
- Quickly select rows and columns to copy data
- Embed pivot grids into reports for easy sharing and viewing
- Save frequently used pivot grid views for easy access and analysis
Create Complex Reports in Minutes
- Create professional-looking reports quickly and easily
- Design report dashboards by embedding reports and charts into a single report
- Organize report data using unlimited groups
- Use the Total Wizard to calculate report and group totals
- Integrate additional data sources to enrich report data
- Create bound and unbound sub-reports and charts to support analysis
- Customize report formatting with no limitations
- Apply one-click quick formatting to ensure consistent styling
- Define and save styles to reuse with just one click
- Enhance report content by inserting drill down reports, pictures, barcodes, page information, rich text fields, shapes, and lines

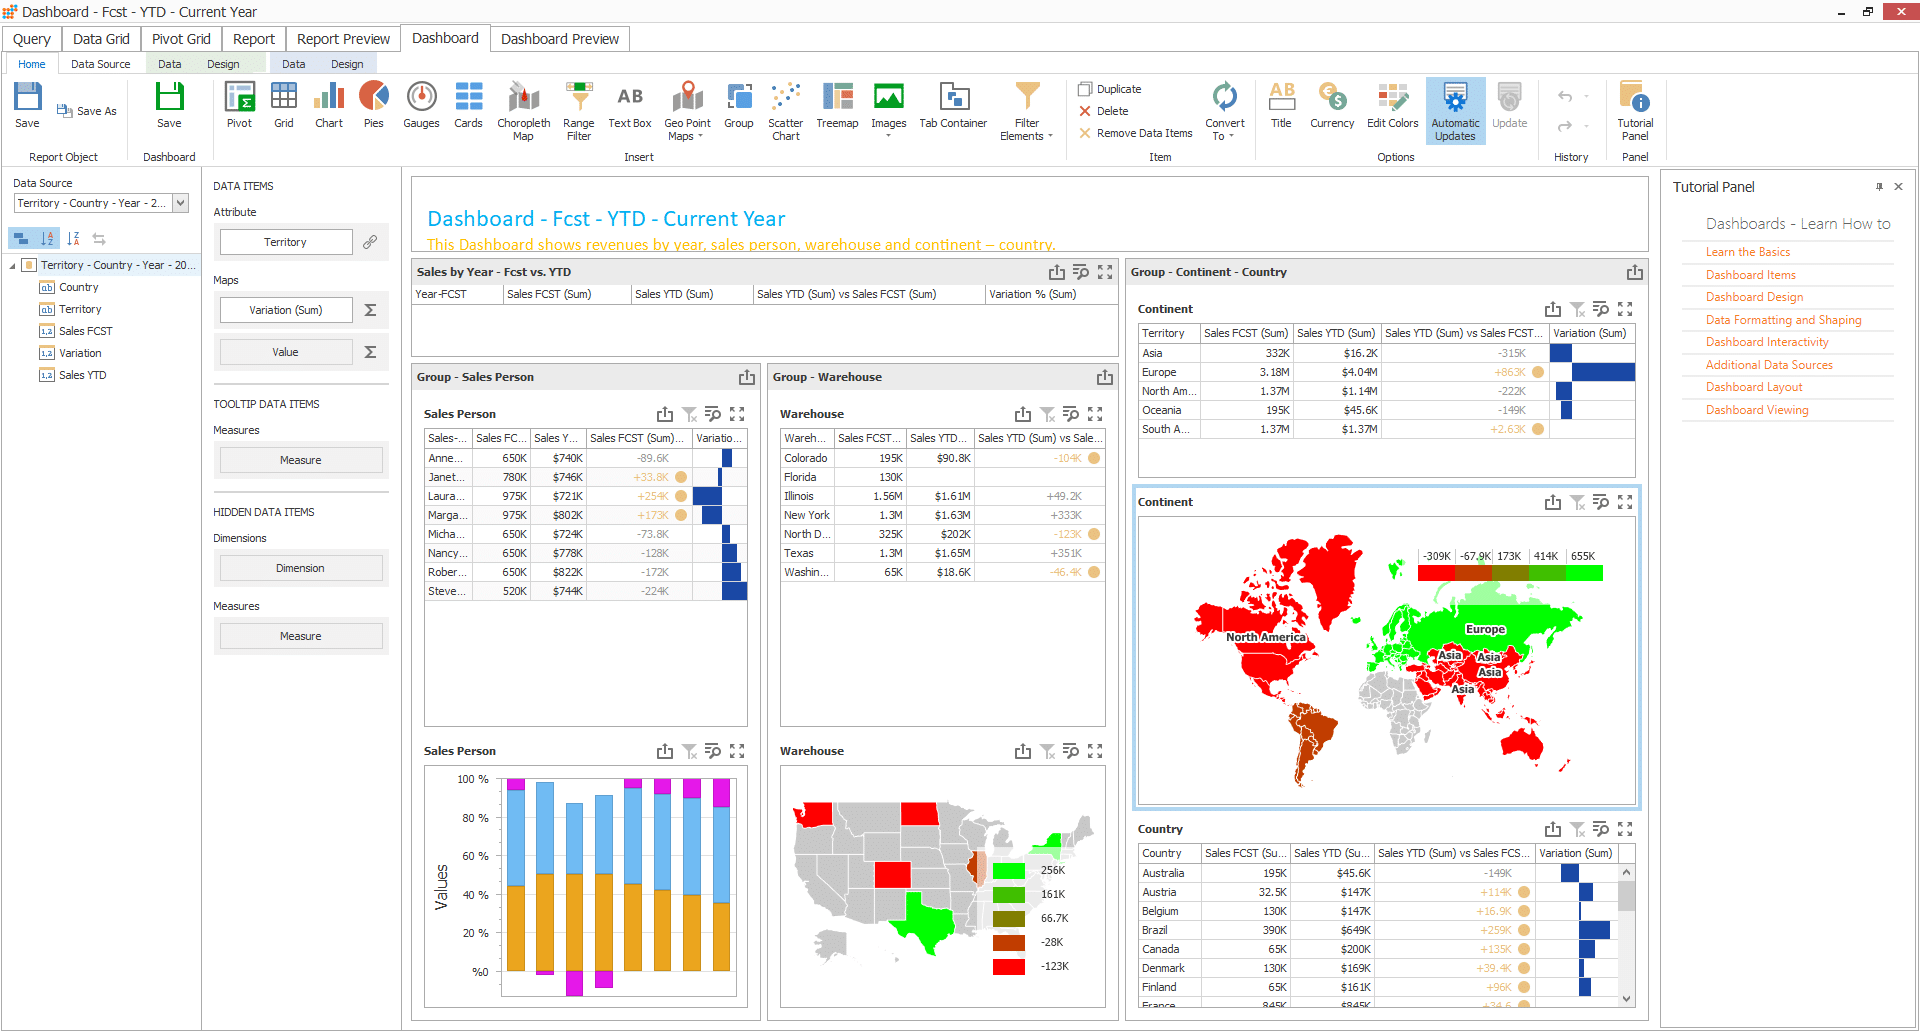
Create Powerful and Interactive Dashboards in No Time
- Use the intuitive drag-and-drop interface to design dashboards quickly
- Prepare data for dashboards easily using the DBxtra Query Builder
- Create filter and drill-down dashboard items in multiple formats including charts, pies, gauges, cards, grids, maps and pivots
- Generate interactive cross-data filters from different data sources for deeper analysis
- Deploy dashboards automatically using the Report Web Service or embed them into web pages with a single line of code
Deploy Reports and Dashboards Automatically
- Save reports to a designated file location for easy retrieval
- Establish a secure, centralized report repository using the Report Web Service
- Streamline report distribution to end-users through the repository
- Access reports and dashboards using the Desktop Report Viewer
- Analyze underlying report object data in Excel in real-time for enhanced insights
In addition to that, the Designer module incorporates the Free Desktop Report Viewer.
System Requirements
- Processor 1Ghz
- 4 GB RAM
- 900 MB available space on hard disk drive
- Windows 7 or newer
- .NET Framework 4.8 (or higher)
If you don’t have it installed than the DBxtra setup will automatically download and install .NET 4.8 for you - Optionally IIS (Internet Information Service) – suggested to publish the web report service
Create Professional Reports Quickly with DBxtra - Download for Free Now!
The trial version is fully operational, with access to multiple sample reports and dashboards.
Additionally, you have the capability to connect to your databases and generate your own reports.